UK house price data by postcode area
Every UK postcode area, with the median asking price, price per square metre, average time on the market, the share of listings that cut their price and how many homes are competing for buyers right now. Search by town, city or postcode letter. Figures cover Jul 2026.
Want a real number on your house?
Tell us the postcode and we'll come back with a price we can complete on. No fee, no obligation, no agent visits.
The UK picture at a glance
These are medians across all 113 postcode areas, so one very expensive or very slow area cannot pull the numbers around.
- Median asking price
- £289,956
- Average time on market
- 125 days
- Listings cutting price
- 26%
- Average price cut
- £17,477
Across all postcode areas
Before a sale is even agreed
Sellers who started too high
Taken off the original asking price
Every postcode area, A to Z
Type a town, city or postcode area in the box, or use the letter buttons. Tap any column heading to sort by it, so you can find the slowest markets or the areas where sellers are discounting hardest.
Showing 113 of 113 postcode areas.
| AberdeenAB | £181,546 | £1,893 | 142 days | 20% | £8k | 9,439 |
|---|---|---|---|---|---|---|
| BathBA | £356,449 | £4,085 | 121 days | 27% | £23k | 18,523 |
| BirminghamB | £289,956 | £3,377 | 123 days | 24% | £18k | 53,142 |
| BlackburnBB | £207,985 | £2,352 | 115 days | 19% | £14k | 13,954 |
| BlackpoolFY | £182,718 | £2,132 | 139 days | 26% | £9k | 12,986 |
| BoltonBL | £250,739 | £2,901 | 121 days | 25% | £13k | 12,159 |
| BournemouthBH | £398,552 | £4,382 | 153 days | 36% | £24k | 34,995 |
| BradfordBD | £220,751 | £2,550 | 142 days | 24% | £13k | 13,744 |
| BrightonBN | £394,176 | £4,724 | 138 days | 32% | £24k | 48,778 |
| BristolBS | £364,995 | £4,292 | 109 days | 23% | £17k | 41,383 |
| BromleyBR | £580,139 | £6,077 | 114 days | 29% | £33k | 14,641 |
| CambridgeCB | £441,211 | £4,802 | 153 days | 28% | £35k | 18,832 |
| CanterburyCT | £334,233 | £3,860 | 146 days | 30% | £22k | 27,436 |
| CardiffCF | £257,986 | £2,937 | 129 days | 24% | £14k | 29,805 |
| CarlisleCA | £228,361 | £2,338 | 96 days | 21% | £14k | 9,025 |
| ChelmsfordCM | £454,063 | £4,873 | 140 days | 25% | £24k | 35,321 |
| ChesterCH | £272,784 | £3,201 | 126 days | 23% | £15k | 17,681 |
| ClevelandTS | £179,314 | £2,333 | 133 days | 25% | £11k | 13,986 |
| ColchesterCO | £324,137 | £3,569 | 125 days | 28% | £18k | 25,085 |
| Comhairle Nan Eilean SiarHS | £165,122 | £1,396 | 122 days | 14% | £7k | 1,002 |
| CoventryCV | £300,716 | £3,400 | 135 days | 26% | £14k | 27,984 |
| CreweCW | £295,601 | £3,120 | 107 days | 20% | £17k | 11,449 |
| CroydonCR | £434,875 | £5,003 | 133 days | 28% | £23k | 16,708 |
| DarlingtonDL | £186,062 | £2,134 | 142 days | 24% | £11k | 9,229 |
| DartfordDA | £399,392 | £4,770 | 131 days | 26% | £19k | 20,176 |
| DerbyDE | £252,927 | £2,969 | 130 days | 29% | £13k | 21,908 |
| DoncasterDN | £199,827 | £2,255 | 130 days | 25% | £13k | 21,390 |
| DorchesterDT | £326,809 | £3,800 | 148 days | 32% | £19k | 10,362 |
| DudleyDY | £264,057 | £3,102 | 141 days | 29% | £14k | 10,667 |
| DumfriesDG | £192,481 | £2,009 | 89 days | 12% | £10k | 11,380 |
| DundeeDD | £172,669 | £2,013 | 148 days | 19% | £9k | 9,956 |
| DurhamDH | £160,796 | £1,939 | 111 days | 25% | £10k | 7,042 |
| EdinburghEH | £285,542 | £3,437 | 105 days | 12% | £15k | 82,804 |
| EnfieldEN | £534,911 | £5,897 | 136 days | 28% | £24k | 15,928 |
| ExeterEX | £313,043 | £3,652 | 130 days | 31% | £21k | 34,059 |
| FalkirkFK | £226,212 | £2,337 | 110 days | 6% | £12k | 24,217 |
| GalashielsTD | £244,458 | £2,235 | 137 days | 9% | £18k | 7,132 |
| GlasgowG | £195,653 | £2,372 | 99 days | 7% | £14k | 96,110 |
| GloucesterGL | £354,687 | £3,959 | 134 days | 28% | £20k | 29,139 |
| GuilfordGU | £518,284 | £5,440 | 126 days | 30% | £41k | 48,464 |
| HalifaxHX | £225,623 | £2,562 | 105 days | 27% | £13k | 4,167 |
| HarrogateHG | £353,676 | £3,861 | 138 days | 29% | £24k | 6,083 |
| HarrowHA | £578,249 | £6,224 | 127 days | 30% | £30k | 21,993 |
| HemelHP | £484,388 | £5,241 | 126 days | 27% | £25k | 26,025 |
| HerefordHR | £342,119 | £3,362 | 81 days | 22% | £22k | 6,984 |
| HuddersfieldHD | £240,636 | £2,810 | 131 days | 23% | £16k | 7,097 |
| HullHU | £199,362 | £2,395 | 126 days | 22% | £10k | 11,791 |
| IlfordIG | £547,218 | £5,815 | 109 days | 25% | £32k | 11,700 |
| InvernessIV | £236,423 | £2,641 | 113 days | 10% | £17k | 18,268 |
| IpswichIP | £312,189 | £3,487 | 123 days | 29% | £18k | 29,850 |
| KilmarnockKA | £158,532 | £1,655 | 89 days | 9% | £68k | 28,773 |
| KingstonKT | £642,090 | £6,567 | 127 days | 30% | £42k | 34,635 |
| KirkaldyKY | £208,306 | £2,387 | 104 days | 12% | £11k | 33,835 |
| KirkwallKW | £228,813 | £2,105 | 278 days | 9% | £24k | 3,324 |
| LancasterLA | £258,111 | £2,858 | 144 days | 24% | £17k | 12,059 |
| LeedsLS | £280,572 | £3,242 | 132 days | 23% | £15k | 21,129 |
| LeicesterLE | £297,540 | £3,302 | 118 days | 28% | £15k | 30,163 |
| LincolnLN | £259,337 | £2,764 | 153 days | 30% | £13k | 11,423 |
| LiverpoolL | £228,010 | £2,706 | 106 days | 16% | £15k | 24,013 |
| LlandrindodLD | £319,299 | £3,043 | 154 days | 24% | £20k | 1,914 |
| LlandudnoLL | £260,772 | £2,863 | 138 days | 23% | £19k | 15,427 |
| London | £688,855 | £9,140 | 119 days | 29% | £51k | 213,587 |
| LutonLU | £338,413 | £4,169 | 108 days | 23% | £17k | 12,386 |
| ManchesterM | £270,261 | £3,570 | 124 days | 21% | £18k | 31,122 |
| MedwayME | £332,894 | £3,876 | 124 days | 26% | £18k | 25,247 |
| Milton KeynesMK | £370,592 | £4,046 | 112 days | 28% | £18k | 22,466 |
| MotherwellML | £184,493 | £1,980 | 115 days | 7% | £9k | 30,762 |
| NewcastleNE | £207,492 | £2,361 | 107 days | 21% | £14k | 28,039 |
| NewportNP | £266,548 | £2,850 | 141 days | 26% | £15k | 14,209 |
| NorthamptonNN | £286,735 | £3,268 | 119 days | 29% | £25k | 29,192 |
| NorwichNR | £289,847 | £3,276 | 133 days | 33% | £15k | 36,812 |
| NottinghamNG | £251,285 | £2,975 | 117 days | 28% | £14k | 39,637 |
| OldhamOL | £249,951 | £2,910 | 170 days | 22% | £13k | 9,538 |
| OxfordOX | £414,609 | £4,869 | 98 days | 19% | £28k | 26,017 |
| PaisleyPA | £187,857 | £2,091 | 116 days | 9% | £10k | 27,001 |
| PerthPH | £234,002 | £2,437 | 123 days | 13% | £13k | 16,245 |
| PeterboroughPE | £266,159 | £2,925 | 133 days | 30% | £14k | 37,979 |
| PlymouthPL | £279,218 | £3,221 | 111 days | 27% | £17k | 27,424 |
| PortsmouthPO | £328,270 | £3,718 | 135 days | 32% | £18k | 43,815 |
| PrestonPR | £248,770 | £2,750 | 124 days | 18% | £14k | 20,343 |
| ReadingRG | £438,546 | £4,901 | 109 days | 21% | £29k | 37,324 |
| RedhillRH | £497,505 | £5,098 | 146 days | 28% | £31k | 28,859 |
| RomfordRM | £427,589 | £5,032 | 129 days | 27% | £22k | 20,660 |
| SalisburySP | £374,925 | £4,001 | 112 days | 27% | £24k | 10,354 |
| SheffieldS | £229,035 | £2,707 | 129 days | 24% | £13k | 33,762 |
| ShetlandZE | £176,200 | £2,003 | 54 days | 4% | £30k | 613 |
| ShrewsburySY | £305,747 | £3,105 | 158 days | 24% | £17k | 11,051 |
| SloughSL | £553,656 | £5,779 | 113 days | 27% | £35k | 18,247 |
| SouthallUB | £460,506 | £5,766 | 124 days | 28% | £24k | 16,628 |
| SouthamptonSO | £406,089 | £4,479 | 139 days | 28% | £23k | 32,805 |
| SouthendSS | £378,152 | £4,442 | 124 days | 27% | £20k | 25,576 |
| St AlbansAL | £602,757 | £6,154 | 135 days | 29% | £28k | 11,790 |
| StevenageSG | £445,987 | £4,933 | 125 days | 24% | £24k | 18,057 |
| StockportSK | £357,243 | £3,826 | 109 days | 20% | £19k | 19,355 |
| Stoke On TrentST | £235,261 | £2,738 | 120 days | 23% | £13k | 18,846 |
| SunderlandSR | £140,901 | £1,718 | 105 days | 23% | £9k | 5,375 |
| SuttonSM | £507,171 | £5,675 | 143 days | 23% | £26k | 8,968 |
| SwanseaSA | £258,109 | £2,607 | 118 days | 26% | £18k | 24,899 |
| SwindonSN | £324,978 | £3,616 | 104 days | 26% | £19k | 20,829 |
| TauntonTA | £298,777 | £3,298 | 130 days | 28% | £17k | 15,462 |
| TelfordTF | £272,400 | £2,926 | 85 days | 31% | £14k | 7,958 |
| TonbridgeTN | £442,140 | £4,578 | 128 days | 31% | £26k | 37,708 |
| TorquayTQ | £296,989 | £3,441 | 138 days | 32% | £18k | 19,583 |
| TruroTR | £336,042 | £4,093 | 142 days | 29% | £23k | 17,679 |
| TwickenhamTW | £582,989 | £6,940 | 117 days | 28% | £35k | 24,510 |
| WakefieldWF | £227,150 | £2,723 | 124 days | 28% | £12k | 13,545 |
| WalsallWS | £275,971 | £3,238 | 121 days | 27% | £14k | 9,725 |
| WarringtonWA | £302,955 | £3,251 | 123 days | 24% | £16k | 19,532 |
| WatfordWD | £564,220 | £5,903 | 120 days | 32% | £28k | 13,101 |
| WiganWN | £220,321 | £2,645 | 107 days | 24% | £11k | 7,840 |
| WolverhamptonWV | £255,948 | £2,987 | 118 days | 28% | £14k | 8,016 |
| WorcesterWR | £345,622 | £3,741 | 125 days | 23% | £22k | 10,255 |
| YorkYO | £291,217 | £3,370 | 148 days | 30% | £16k | 20,554 |
What each column means
- Area
- The postcode area, named after its main town or city. S is Sheffield, LS is Leeds, and so on.
- Median asking price
- The midpoint asking price of homes currently for sale here. Half are listed above it, half below. It is what sellers are asking, not what buyers paid.
- Price per m²
- Average asking price divided by floor area. The fairest way to compare two areas because it strips out the size and type of home.
- Average time on market
- How many days a home sits listed before a sale is agreed. Conveyancing and the buyer's mortgage add roughly twelve weeks after that.
- Listings cutting price
- The share of homes for sale here that have dropped their asking price at least once. A high share means first asking prices are routinely too optimistic.
- Average price cut
- Among the homes that did drop their price, the average amount in pounds knocked off the original asking price.
- Homes for sale
- How many homes are listed for sale in this area right now. More listings means more competition for the same buyers.
Source: Outra listings data, Jul 2026. Asking prices, not sold prices. Last refreshed 6 August 2026.
How to read these numbers before you sell
Asking price is what sellers hope for. The reduction rate is what the market actually pays attention to. In areas where a third of listings have already cut their price, an agent valuation is a starting position rather than a forecast, and the gap between the first asking price and the eventual sale price is often wider than the discount on a cash offer once you take fees, months of mortgage payments, bills and the risk of a chain collapse into account.
Time on market is the figure that catches people out. It measures how long a property sits listed before a sale is agreed, not how long the whole sale takes. Add conveyancing, searches and a mortgage offer on top and the honest end-to-end number in most areas runs past five months. If you have a fixed date to work to, read what we pay and why and compare it against the local figures above.
Using this data in your own work
Journalists, brokers and researchers are welcome to quote any figure on this page. Credit The Quick House Buyers with a link to this page and credit Outra as the data source. If you need a cut of the data we have not published here, such as a specific outcode or a longer time series, get in touch and we will pull it.
Questions about this data
- Where does this house price data come from?
- It comes from Outra's listings dataset, aggregated by postcode area. The figures are built from current and recent for-sale listings, so they show asking prices and live market behaviour rather than completed Land Registry sold prices.
- How often is the data updated?
- The underlying table is refreshed monthly. The refresh date and the period the figures cover are both shown directly under the table, so you can see exactly how current the numbers are.
- What does the price reduction rate tell me?
- It is the share of listings in that postcode area that have cut their asking price. A high rate means sellers in that area are routinely starting too high and having to come down to find a buyer, which is a good indicator of how much negotiating room a buyer expects.
- Is time on market the same as how long a sale takes?
- No, and this is the number most sellers underestimate. Time on market measures how long a property sits listed before a sale is agreed. Conveyancing, searches, mortgage offers and chain delays all come after that, and typically add a further two to four months.
- Can I republish these figures?
- Yes. Use them in articles, reports or presentations with a credit to The Quick House Buyers and a link back to this page, plus a credit to Outra as the data source.
Sources
Want a real number on your house?
Tell us the postcode and we'll come back with a price we can complete on. No fee, no obligation, no agent visits.
Use the data next to these
 What we payHow we work our offer out from market value, and why it lands where it does.
 Cash buyer vs estate agentNet proceeds and timelines side by side, using the same market figures.
 Sell house fastThe main hub for a fast sale on a date you choose.
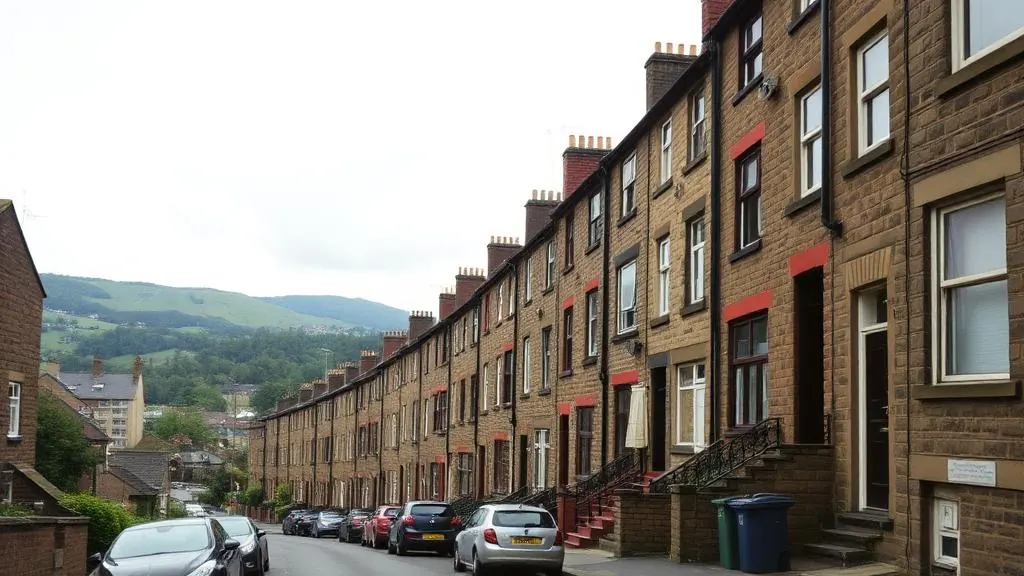 Sell house fast in SheffieldLocal market data plus the housing stock and search issues specific to the S postcodes.
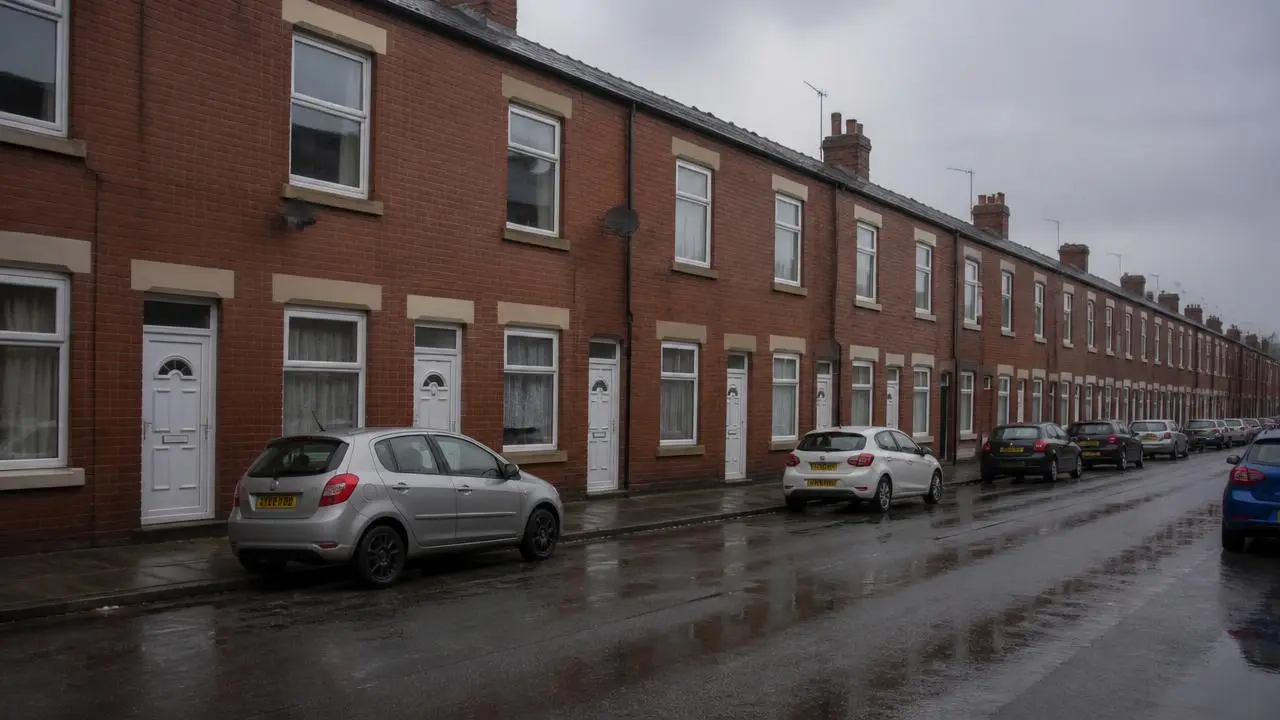 Sell house fast in ManchesterEx-council terraces and city-centre leasehold flats in the M postcodes.
- All guidesThe full library, grouped by situation.